Last updated: 04/2023
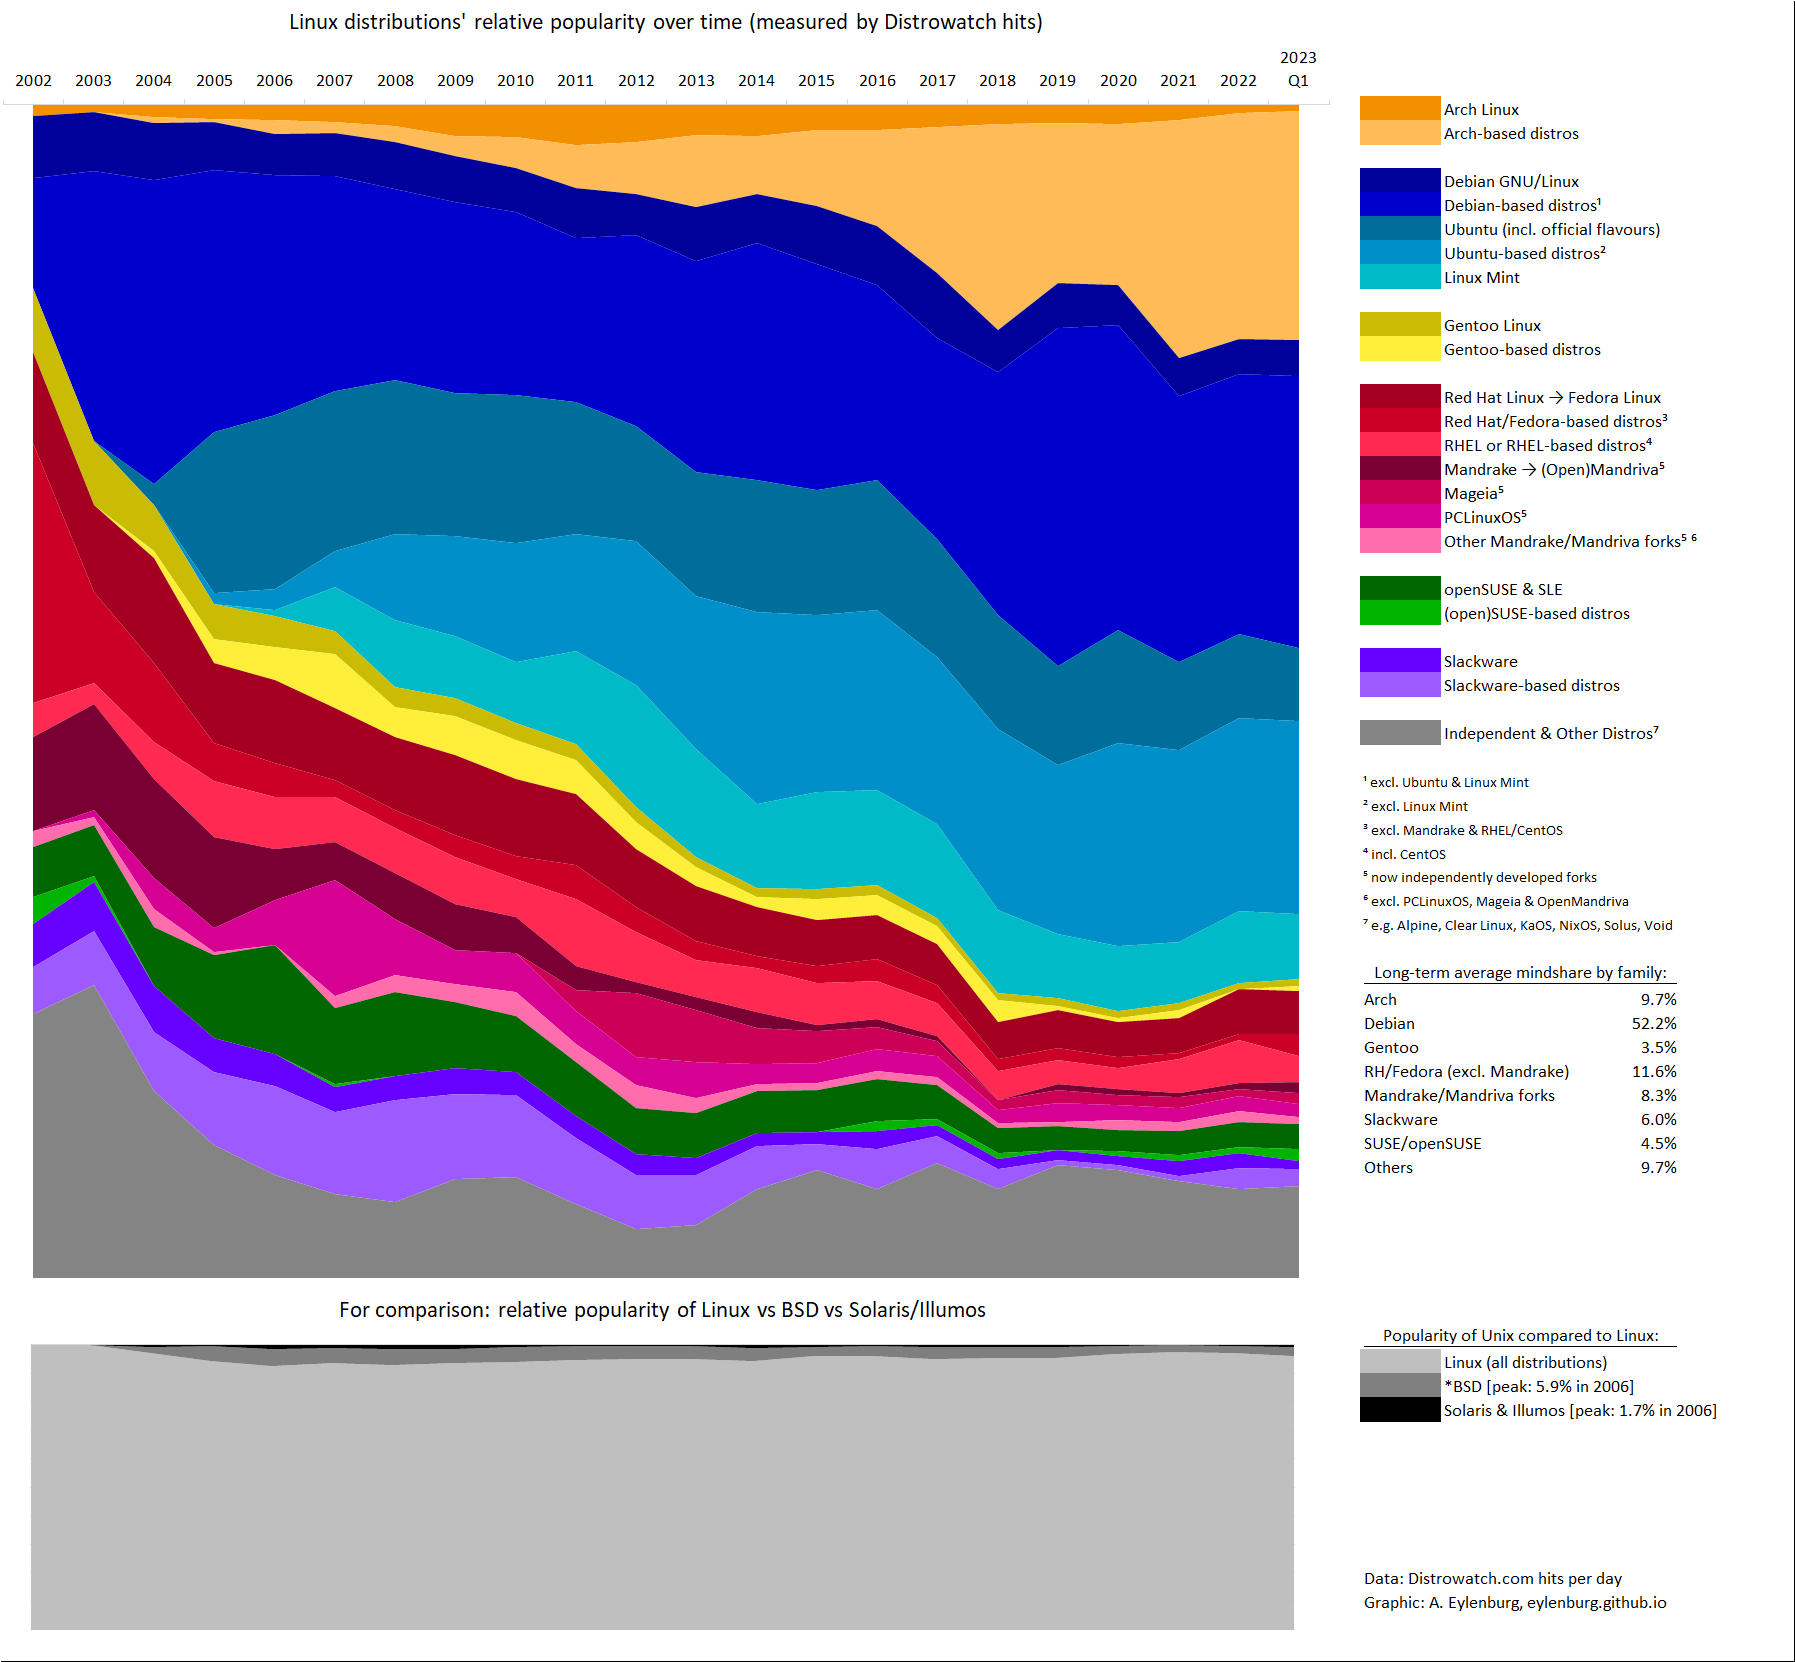
The graph below shows the relative amount of hits on Distrowatch for the different Linux distributions, grouped by larger distro families and ancestries. The data is available for 2002-2023Q1. As well all know, Distrowatch hits are NOT a reliable indicator for the market share - just think of the mysterious #1 position of MX Linux - but nevertheless it's quite interesting to see how things have changed over time. The greater Debian family now dominates, although Arch-based distros have also recently gained a lot of popularity. At the same time, Gentoo, Slackware, (open)SUSE, Red Hat/Fedora and Mandriva have lost in the Distrowatch rankings compared to the early 2000s.
How to read it? Like any other diagram showing market share over time. The x-axis moves along the years starting in 2002, and the thickness of the coloured slices along the y-axis indicates the relative amount of Distrowatch hits compared to other Linux distributions. In the large chart at the top, all Linux distributions add up to 100%. In the smaller chart at the bottom it works similarly, with Linux, *BSD, and Solaris/Illumos adding up to 100% and the relative thickness showing the relative amount of clicks of these three OS families. (Note that the two charts are not using the same scale on the y-axis.)